SCADA System Software
Introduction to SCADA
The SCADA system is an integral part of our ecosystem and is designed for comprehensive management, data collection, real-time monitoring, and analysis of technological processes. Its primary purpose is to provide users with accurate and up-to-date information about the current status of equipment and production processes, as well as tools for remote infrastructure control.
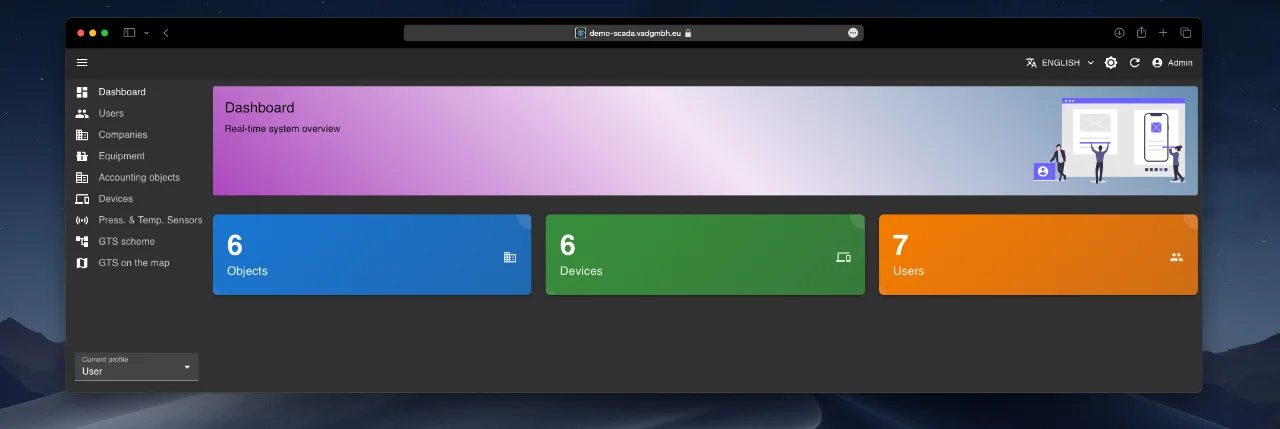
The system supports flexible integration: it can interact with the IoT platform via REST API and connect with external systems upon request. Data for analysis and monitoring can be sourced both from integrated systems and directly from a wide range of sensors and devices. The SCADA system supports our full range of equipment and is also compatible with third-party instruments that support standard industrial communication protocols such as MQTT, HTTP, OPC UA, and others.
Working with the Platform
The SCADA system is accessed exclusively through a web interface built on a modular principle. The interface is intuitive and consistent across all modules, ensuring ease and speed of adoption.
General Interface Principles
The web interface consists of three main components:
- Top panel: Contains user profile controls, including language switching and theme selection.
- Left panel: Serves as the main navigation menu, allowing users to move between functional modules.
- Central area: Acts as the primary workspace. Selecting any menu item displays the corresponding module content here.
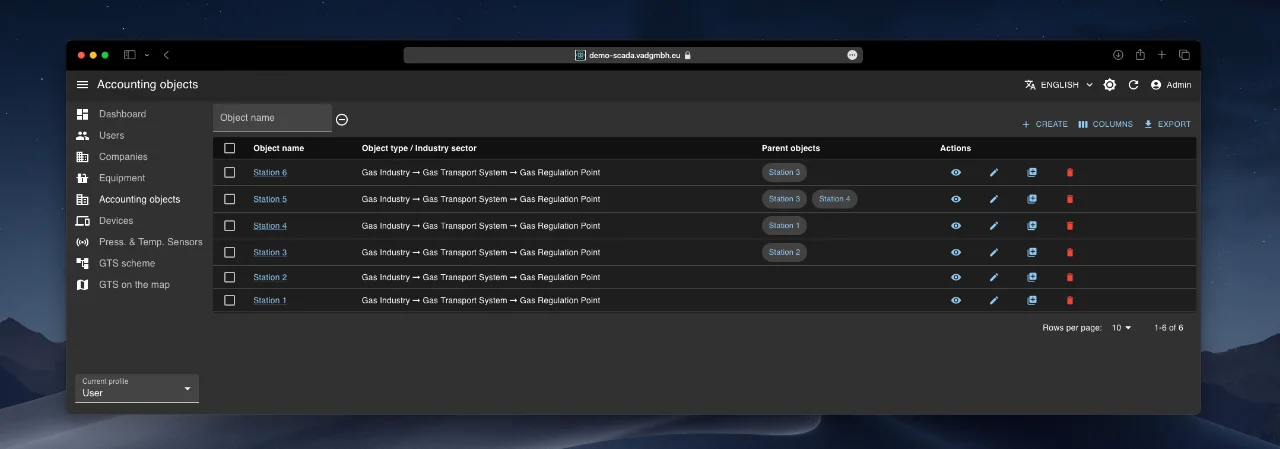
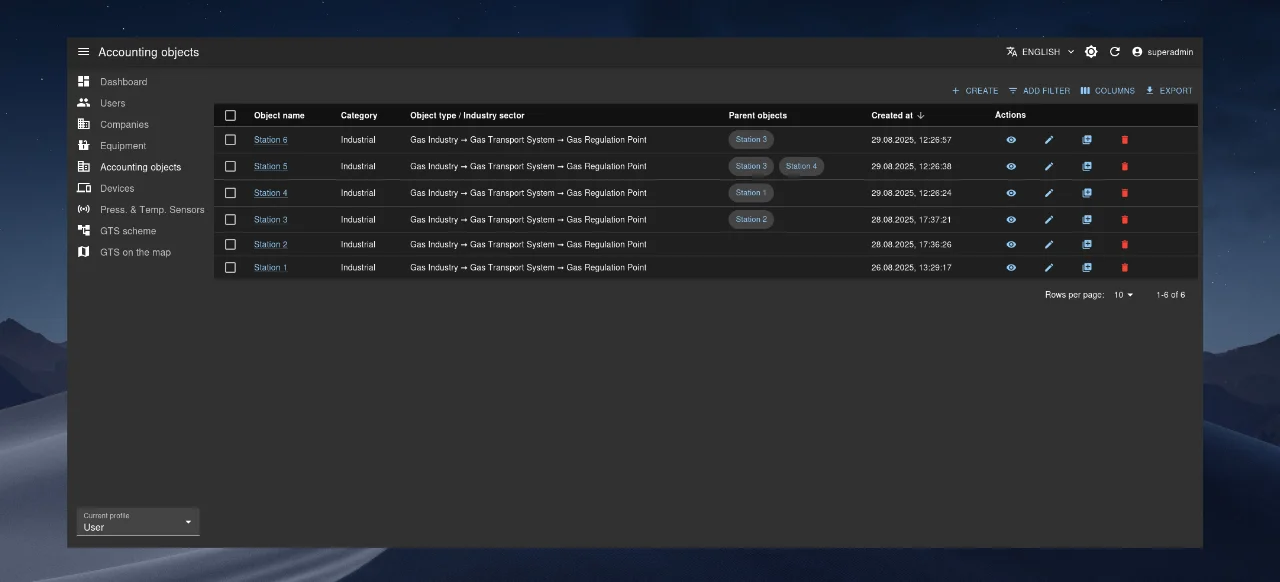
Data in each module is presented as a dynamic table in the central area. Each table row represents a single record (user, company, device, etc.) and includes a quick-action panel with the following options:
- View all record properties (👁️ “eye” icon)
- Edit the record (✏️ “pencil” icon)
- Clone the record
- Delete the record (🗑️ “trash” icon)
Above the table is a top control panel containing:
- Filter/Search button (“Add filter”)
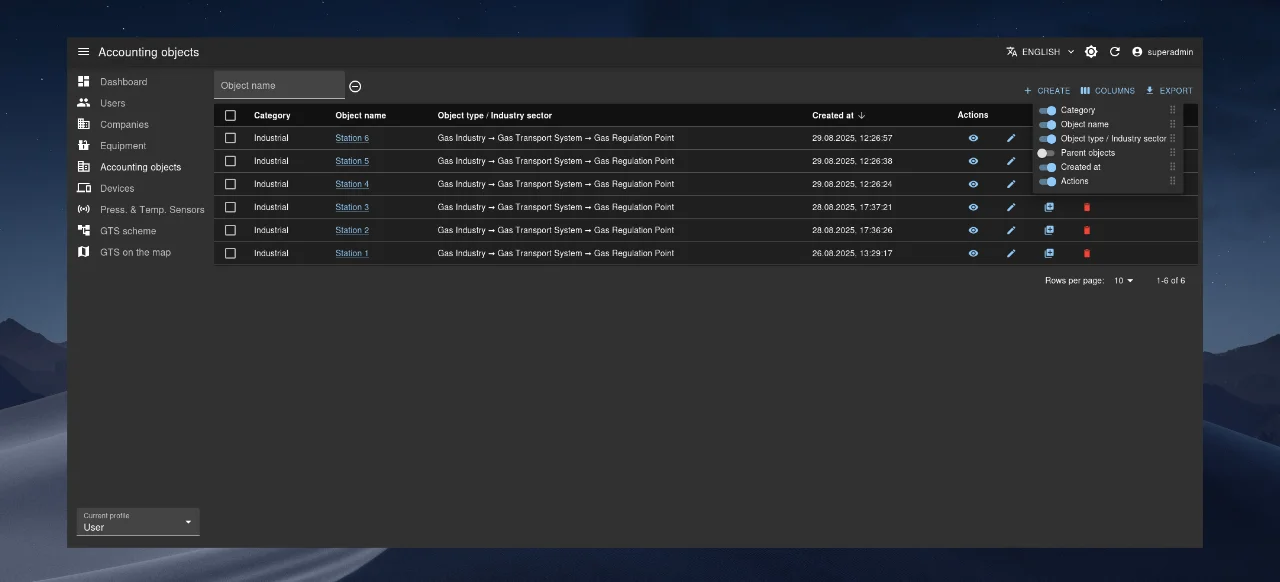
- Column visibility toggle
- Export data button
- “Create” button ("+ Create" or similar)
Additionally, the table supports bulk operations. To perform them:
- Select the desired rows using checkboxes at the start of each row.
- Use the corresponding buttons on the top control panel (e.g., bulk delete or export).
Core System Modules
The system includes the following functional modules:
- Users: Manage access and user accounts.
- Companies: Manage companies associated with the system.
- Metering Points: Manage infrastructure objects where IoT devices are installed.
- Devices: Manage IoT devices.
- Equipment: Configure types of equipment used.
- Schedule: Manage device communication schedules.
- Object Map: Visualize object locations on a map.
- Object Diagram: Build and view connection topologies.
- Audit Module: Track all user-initiated changes in the system.
Users Module
This module provides centralized management of user accounts, including creation, editing, activation/deactivation, and deletion.
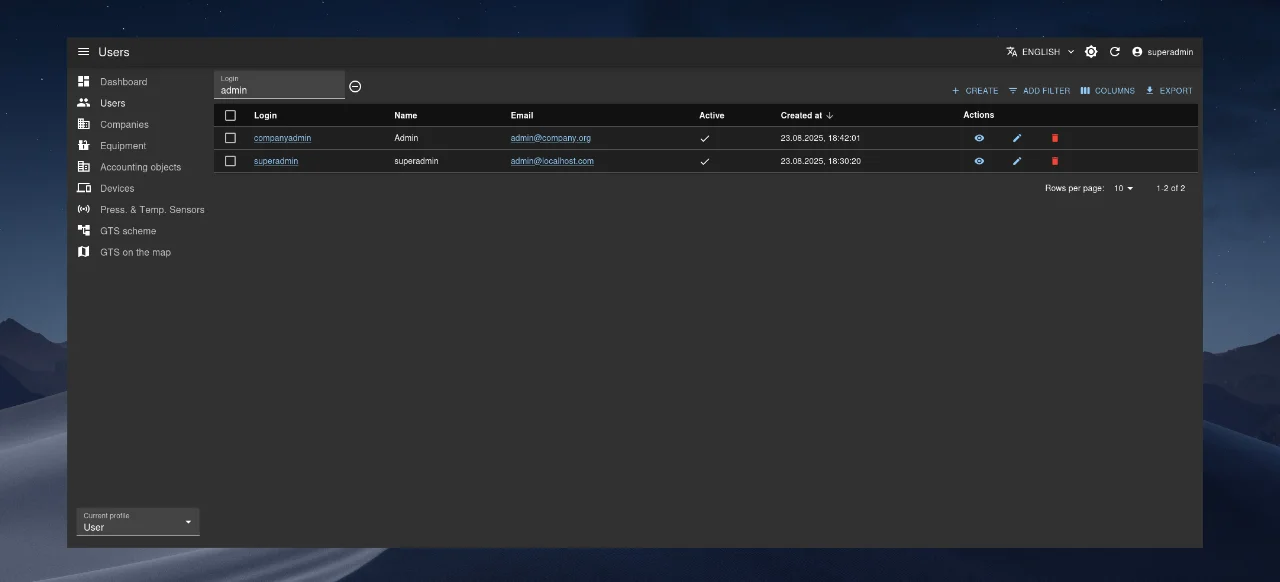
User List and Search
All users are displayed in a table (see image below). To find a specific user, use the filtering function: click “Add filter” and enter search criteria (Login, Email, or Name).
Creating a User
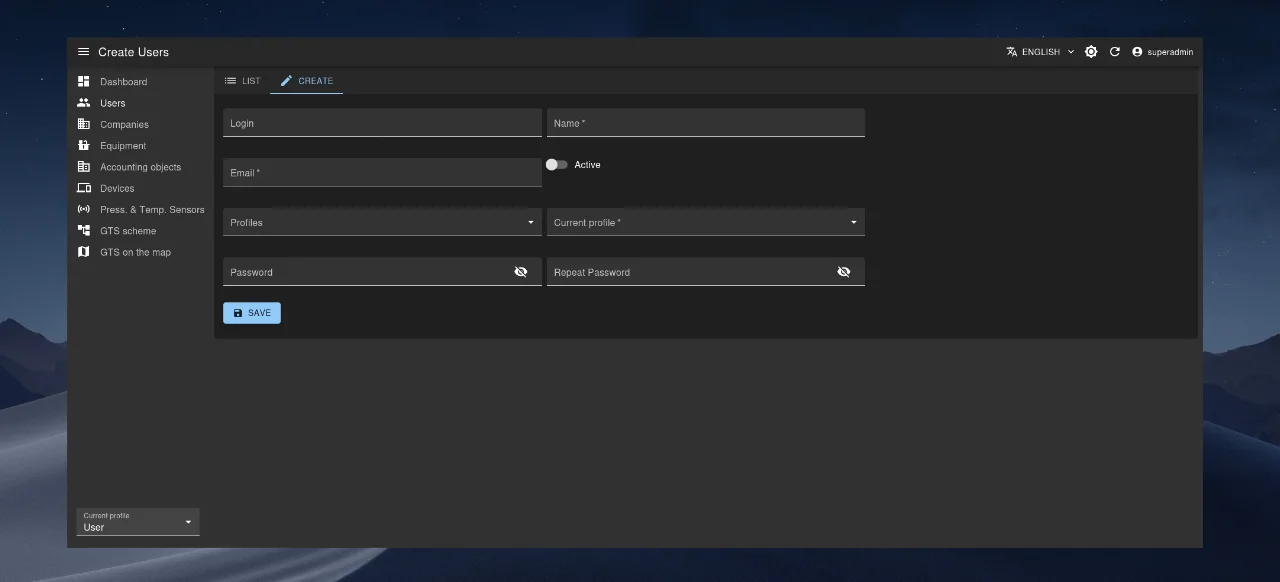
- Click “Create”.
- Fill in the required fields:
- Login
- Name
- Profiles
- Current Profile
- Password
- Confirm Password
- To activate the new account, switch “Active” to “On”.
- Click “Save”.
If validation errors occur, correct the highlighted fields and retry.
The email address (“Email”) of each user in the system must be unique.
Editing, Viewing, and Deleting a User
- Edit: Click the ✏️ “pencil” icon in the corresponding row. Alternatively, if already on the profile page, click Settings/Edit in the top subpanel. To temporarily block an account, switch “Active” to “Off”.
- View: Click the 👁️ “eye” icon in the table. If on the edit page, switch to view mode via Settings/View.
- Delete: Click the 🗑️ “trash” icon in the user’s row.
Companies Module
This module manages the directory of companies interacting with the system. It supports both flat and hierarchical data representation.
Display Modes: “List” and “Hierarchy”
Two tabs at the top allow switching between views:
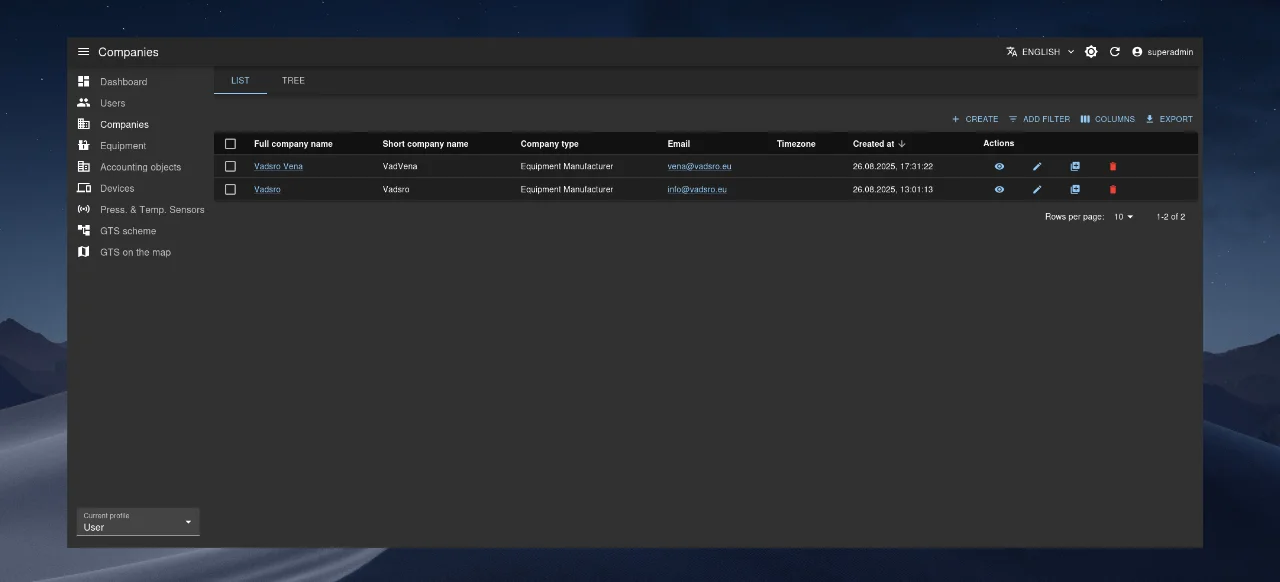
- List (see “Company List” image): displays all companies in a flat table.
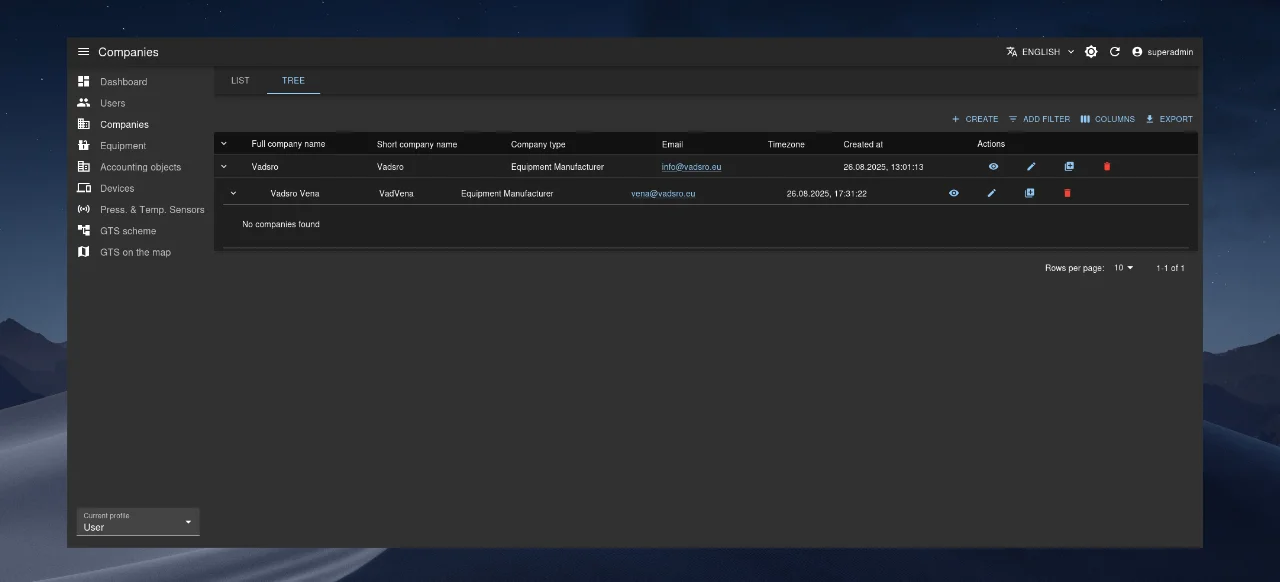
- Hierarchy (see “Company Tree” image): shows parent-child relationships. Expand/collapse nested companies using the arrow next to the company name.
Creating a Company
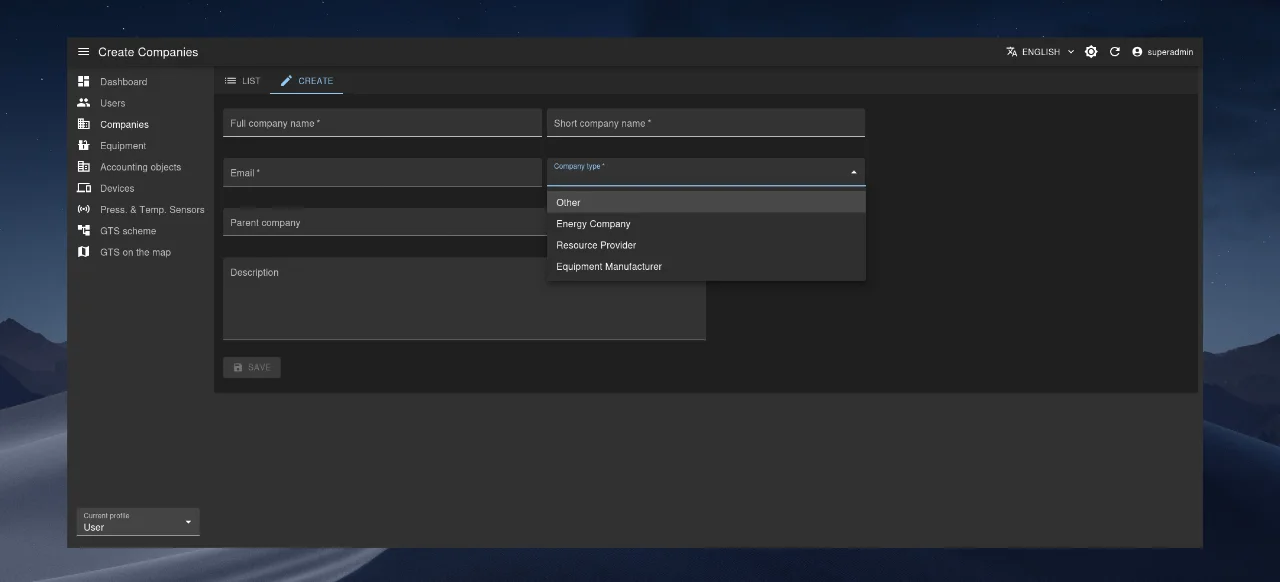
- Click + Create in the top-right corner.
- Fill in the form:
- Full Company Name (required)
- Short Company Name (required)
- Company Type (dropdown selection)
- Email (required)
- Parent Company (optional)
- Description (optional)
- Click “Save”.
Editing, Viewing, and Deleting a Company
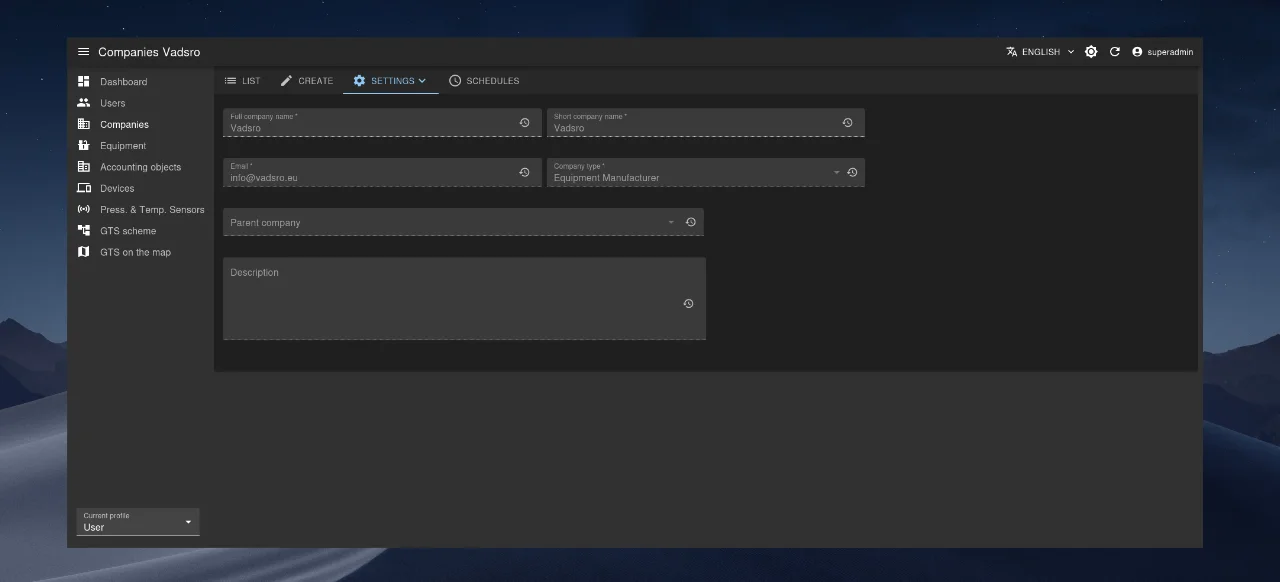
- Edit: Click ✏️ “pencil” icon or use Settings/Edit on the profile page.
- View: Click 👁️ “eye” icon or switch via Settings/View.
- Delete: Click 🗑️ “trash” icon in the company’s row.
Metering Points Module
This module manages infrastructure objects where IoT equipment is installed and operated.
Object List and Search
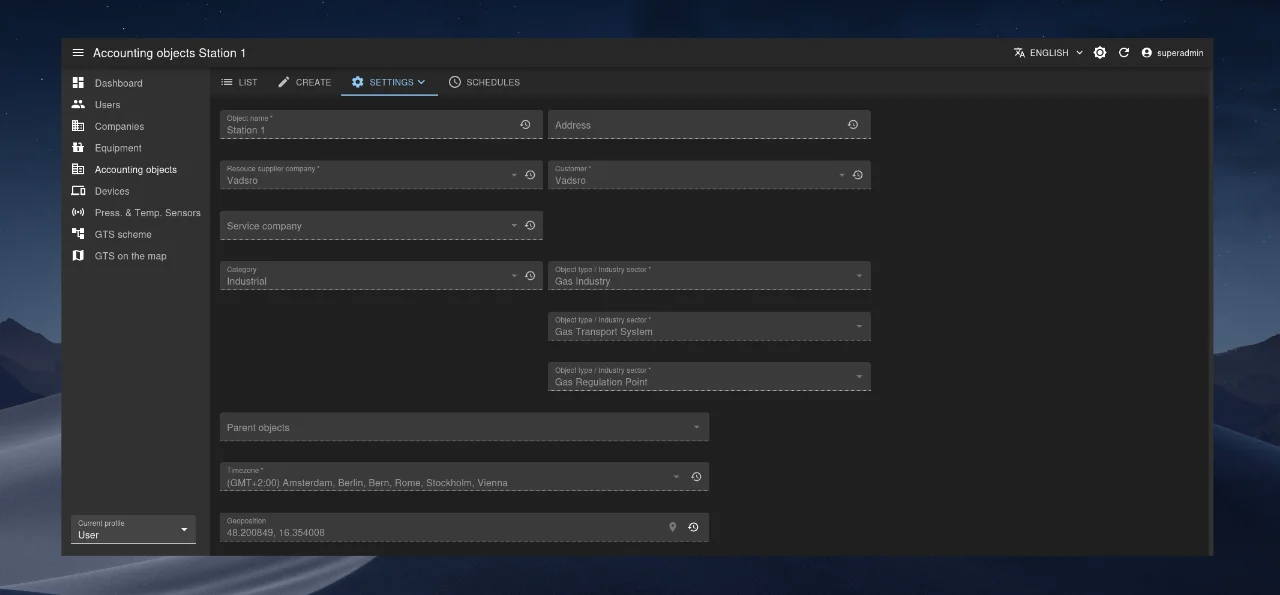
All objects are shown in a table (see image below). Use “Add filter” to search by name, company, category, etc.
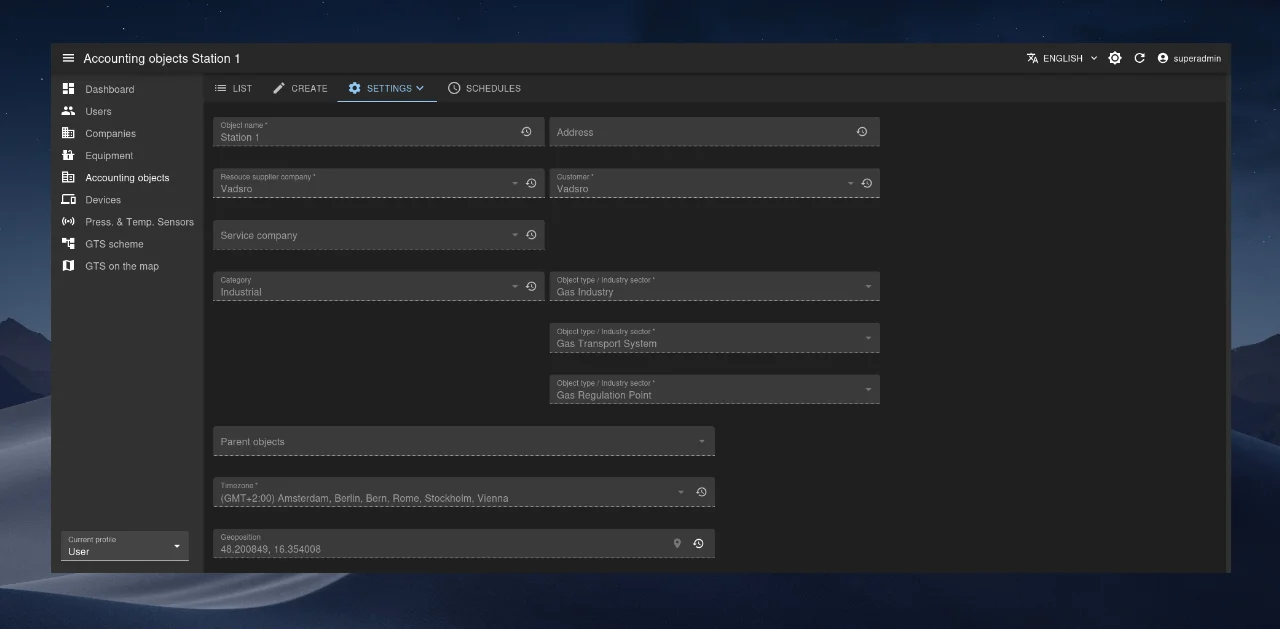
Creating an Object
- Click + Create.
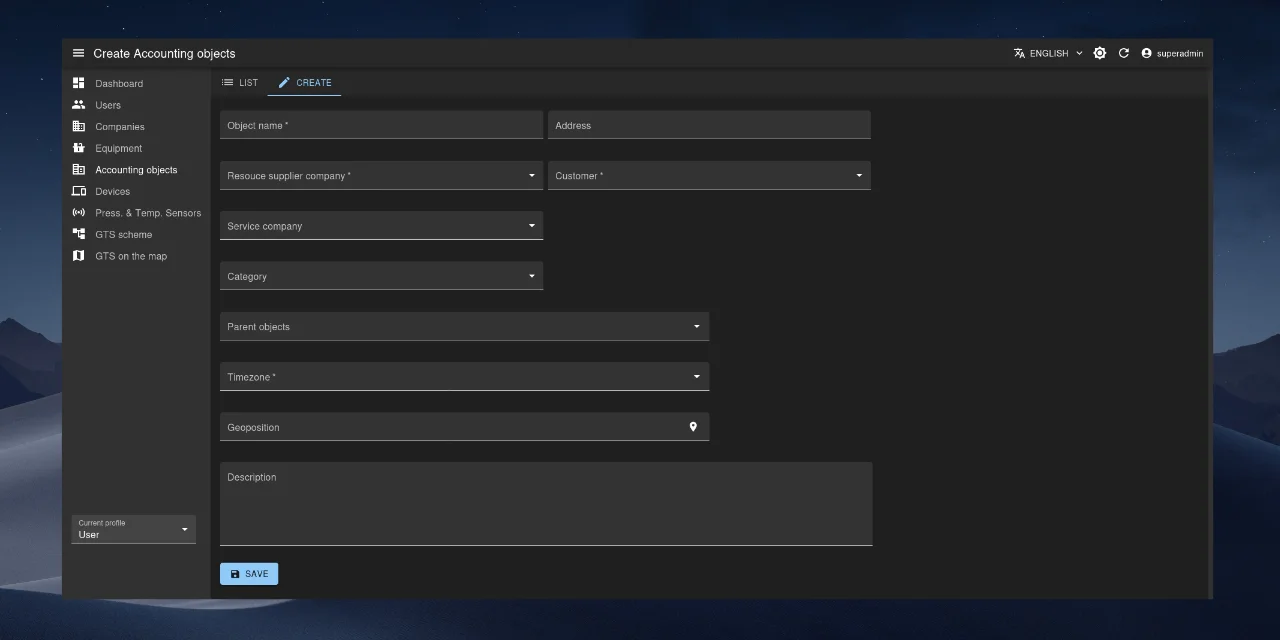
- Fill in the fields:
- Object Name (required)
- Resource-Supplying Company (required)
- Consumer (owner company, required)
- Category (optional dropdown)
- Time Zone (required)
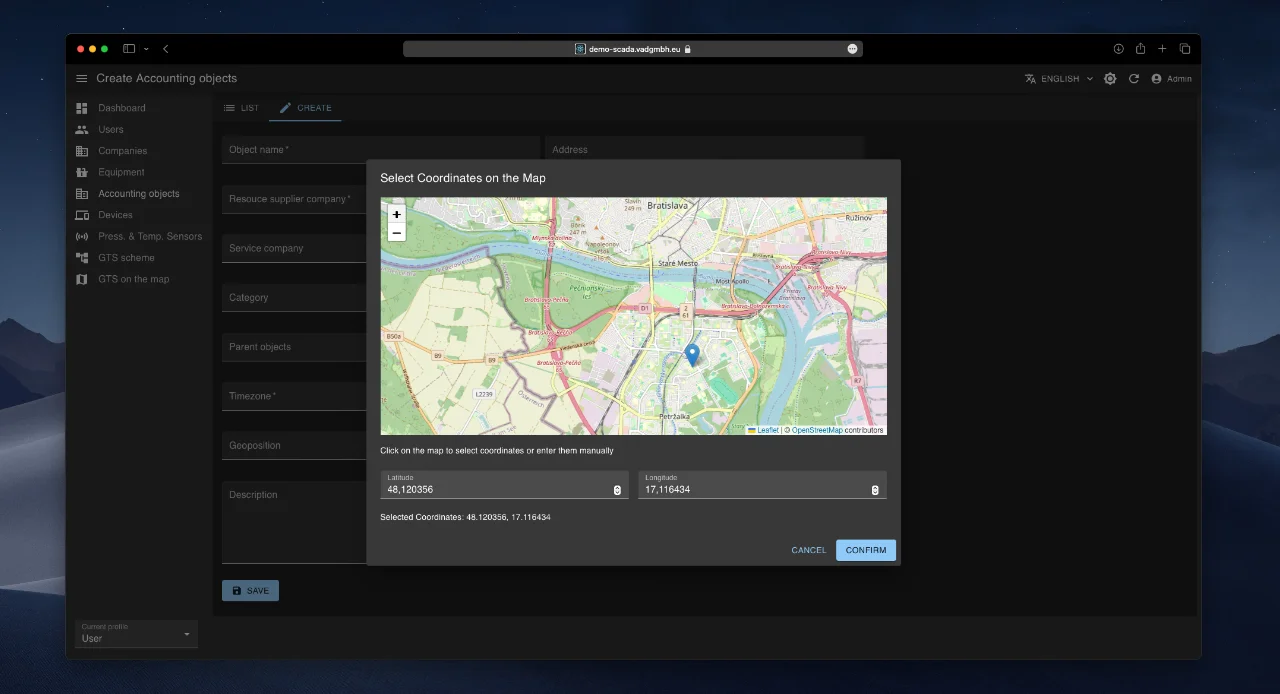
- Coordinates (optional; selected via popup map)
- Address (physical address)
- Parent Objects (optional; e.g., for gas pipeline hierarchy)
- Description (optional)
- Click “Save”.
Editing, Viewing, and Deleting an Object
- Edit: ✏️ icon or Settings/Edit
- View: 👁️ icon or Settings/View
- Delete: 🗑️ icon in the object’s row
Equipment Module
This module enables centralized registration and configuration of all equipment types used in IoT devices: sensors, utility meters, telemetry blocks, smart devices, etc.
Important
Access to the Equipment module is granted only to users with administrator privileges.
Equipment List and Search
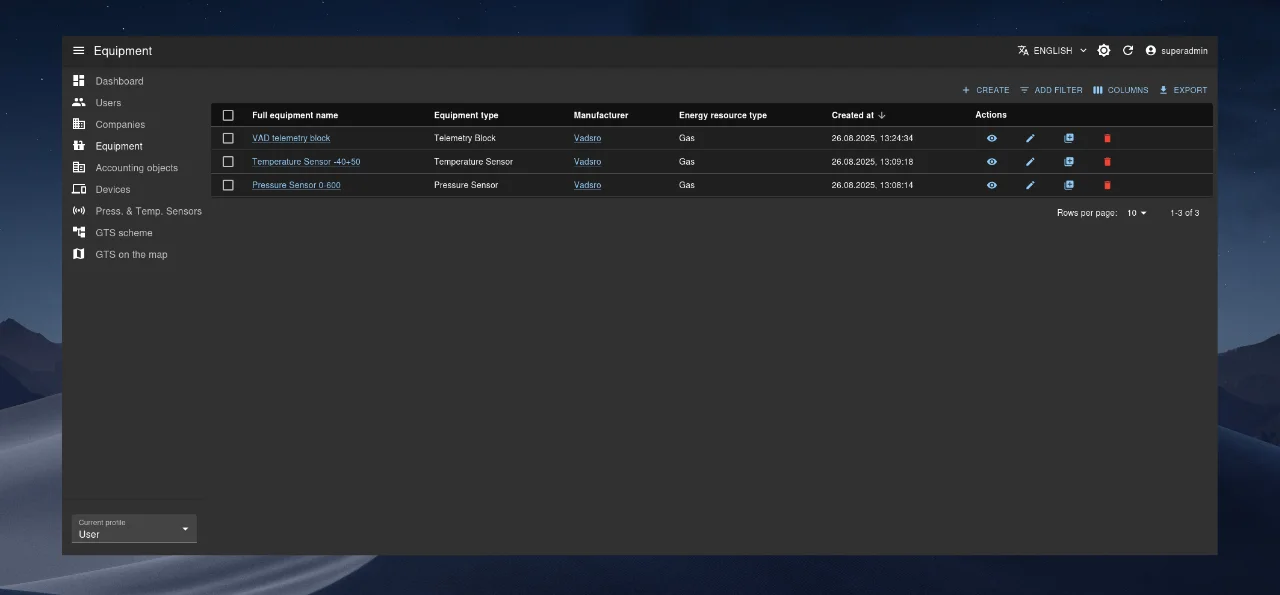
All registered equipment is displayed in a table (see image below). Use “Add filter” to locate specific equipment types.
Adding New Equipment
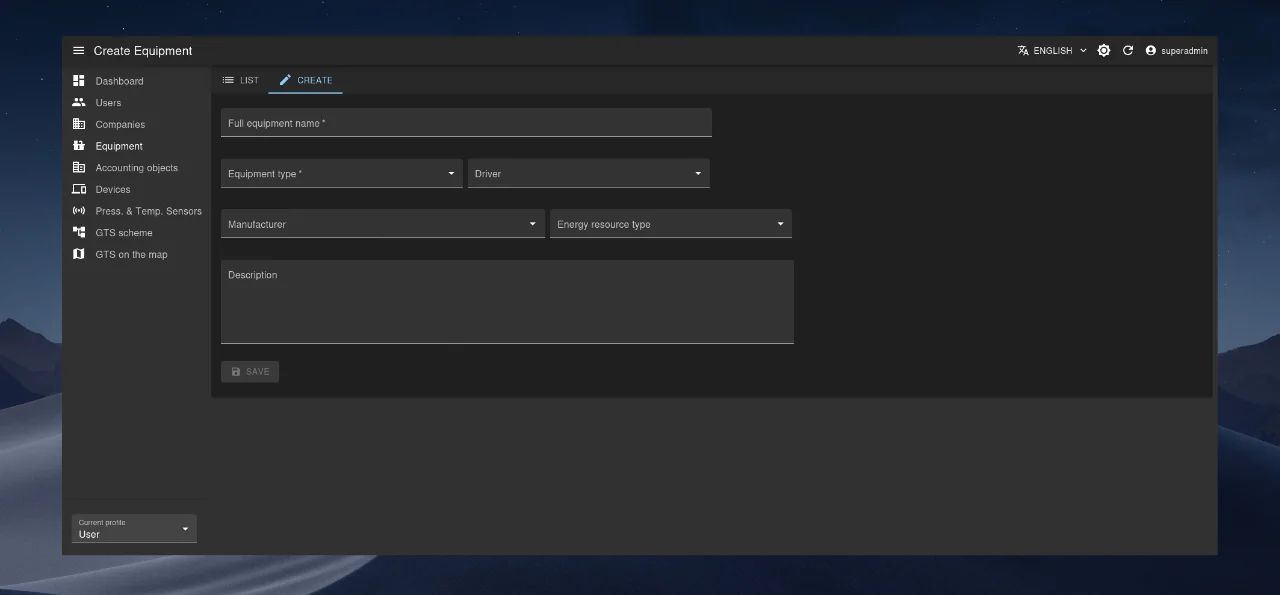
- Click + Create.
- Fill in the form:
- Full Device Name (required)
- Device Type (required dropdown)
- Driver (optional)
- Manufacturer (optional)
- Energy Resource Type (optional)
- Description (optional)
- Click “Save”.
Editing, Viewing, and Deleting
- Edit: ✏️ icon or Settings/Edit
- View: 👁️ icon or Settings/View
- Delete: 🗑️ icon in the equipment row
Devices Module
This is one of the key modules, designed to manage IoT devices—the primary data sources for monitoring and control. Each IoT device is a composite unit consisting of one or more equipment items registered in the Equipment module.
Device List and Search
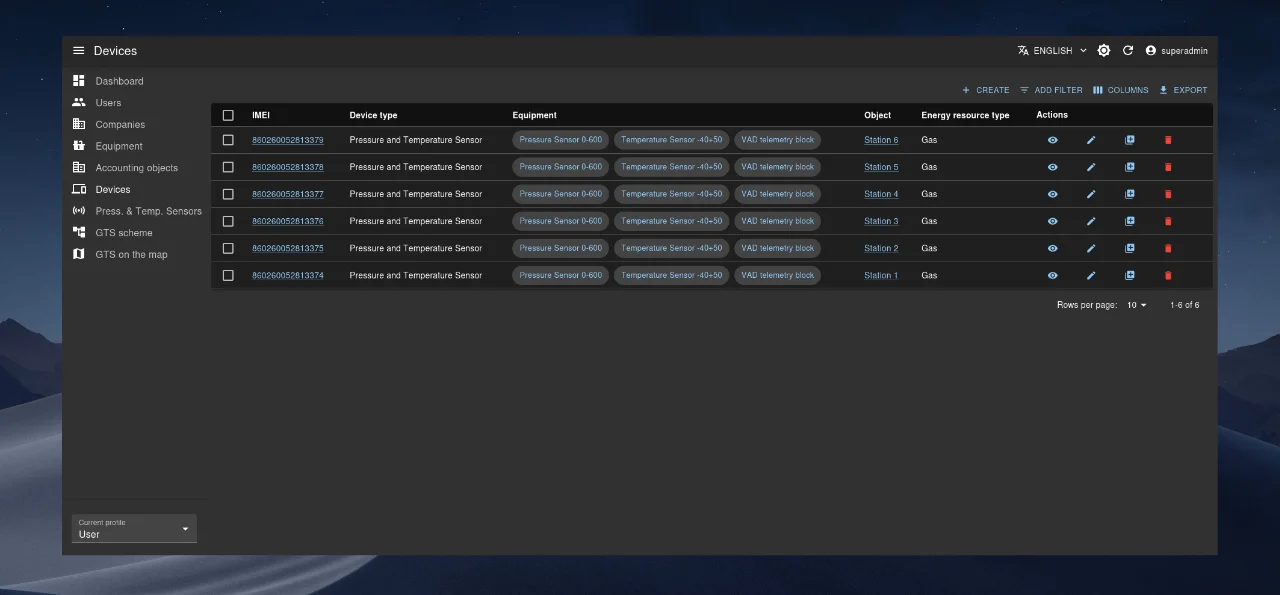
All IoT devices are listed in a table (see image below). Search criteria include:
- Unique ID (
IMEI) - Device Type (
Device type) - Equipment Components (
Equipment)
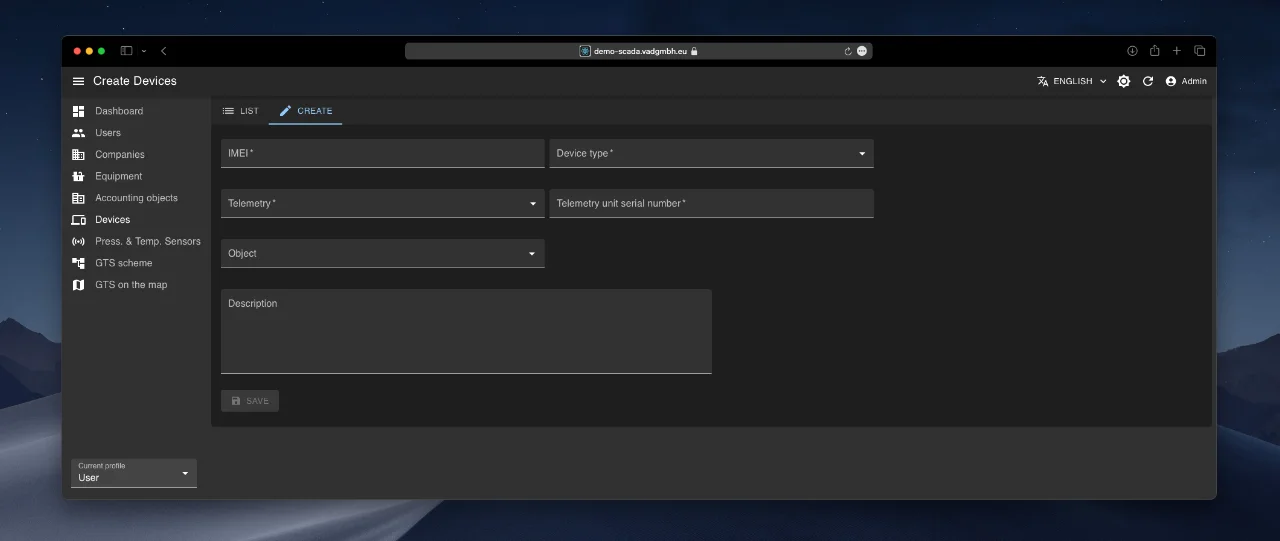
Adding a New Device
- Click + Create.
- Fill in required fields:
- IMEI (unique identifier, required)
- Device Type (required dropdown)
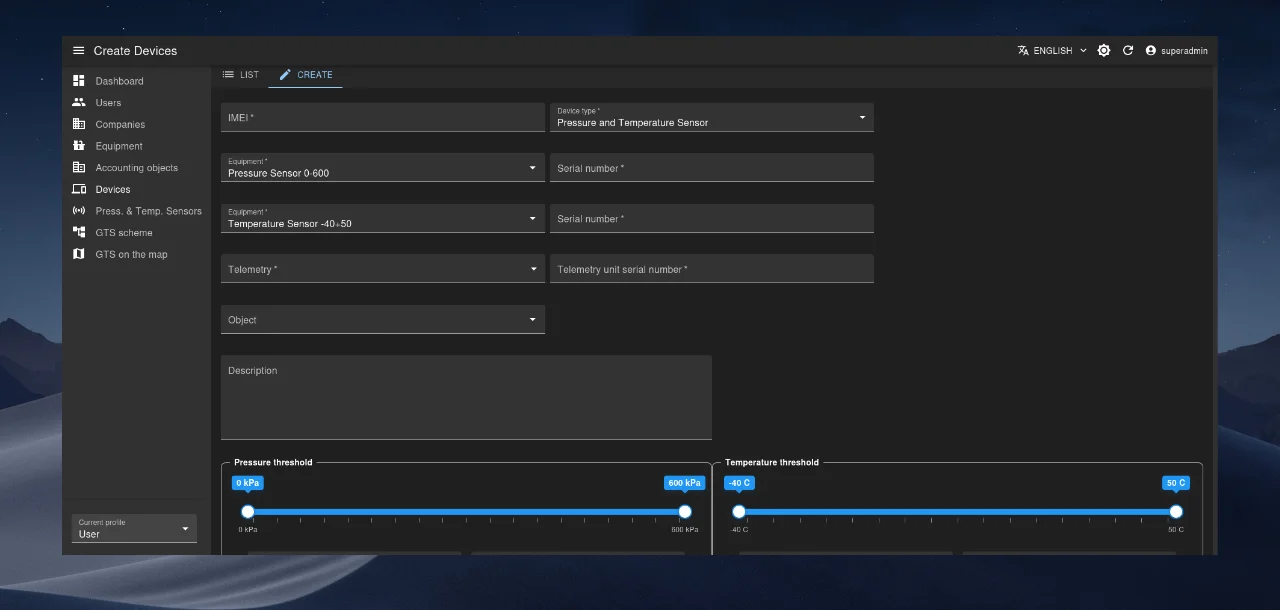
After selecting a device type, the form dynamically updates with type-specific fields.
Example: For a “Pressure and Temperature Sensor” type, two Equipment fields appear:
- In the first, select a pressure sensor.
- In the second, select a temperature sensor.
For each selected sensor, specify its Serial Number.
Set alarm thresholds: Pressure Alarm Thresholds and Temperature Alarm Thresholds.
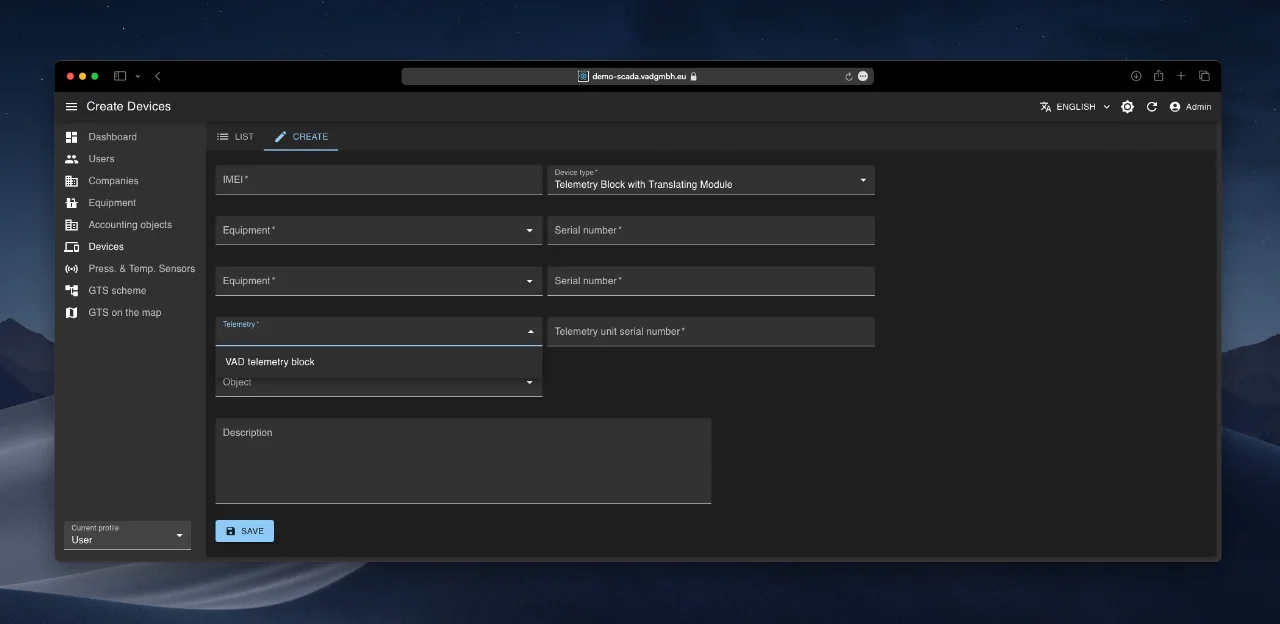
Complete the remaining fields:
- Telemetry: Telemetry block type (from equipment list, required)
- Telemetry Serial Number (required)
- Driver (optional)
- Object (where the device is installed, optional)
- Description (optional)
- Click “Save”.
Editing, Viewing, and Deleting
- Edit: ✏️ icon or Settings/Edit
- View: 👁️ icon or Settings/View
- Delete: 🗑️ icon in the device’s row
Schedule Module
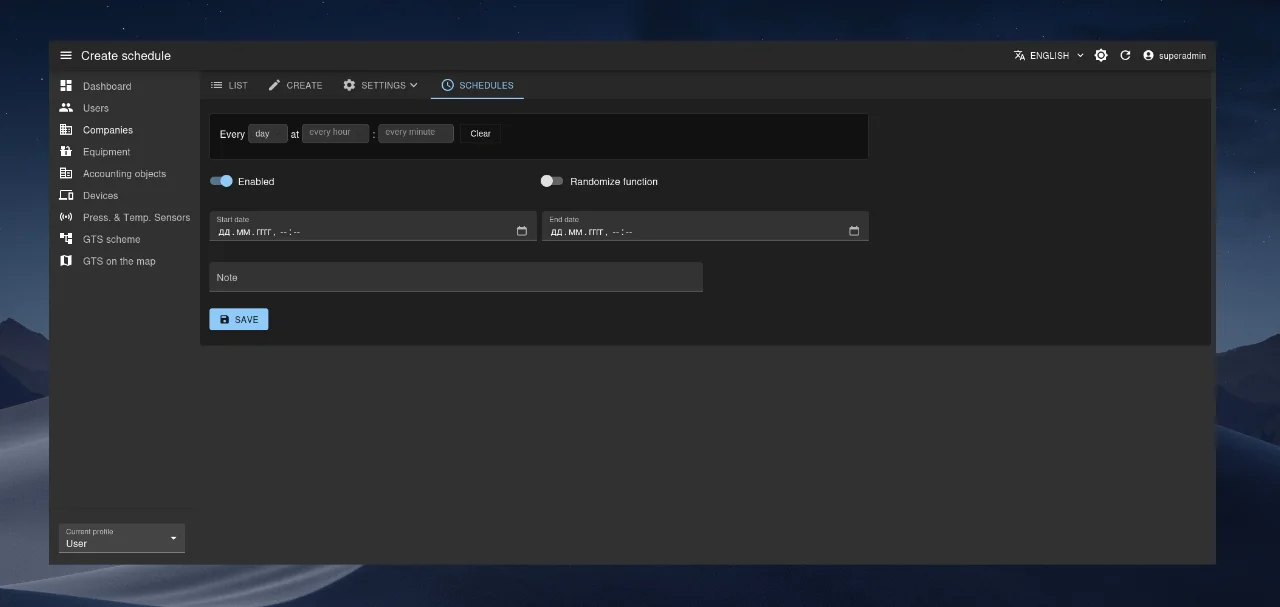
This module1 allows you to manage device communication frequency—i.e., how often devices connect to the server to exchange data.
Scheduling can be configured at three levels: Company, Metering Point, and Device. Schedules are inherited along the hierarchy: Company → Metering Point → Device. The system automatically selects the most specific (closest) schedule and sends it to the device during the next communication session.
A Schedules tab is available in each of the above-mentioned modules (Company / Metering Point / Device).
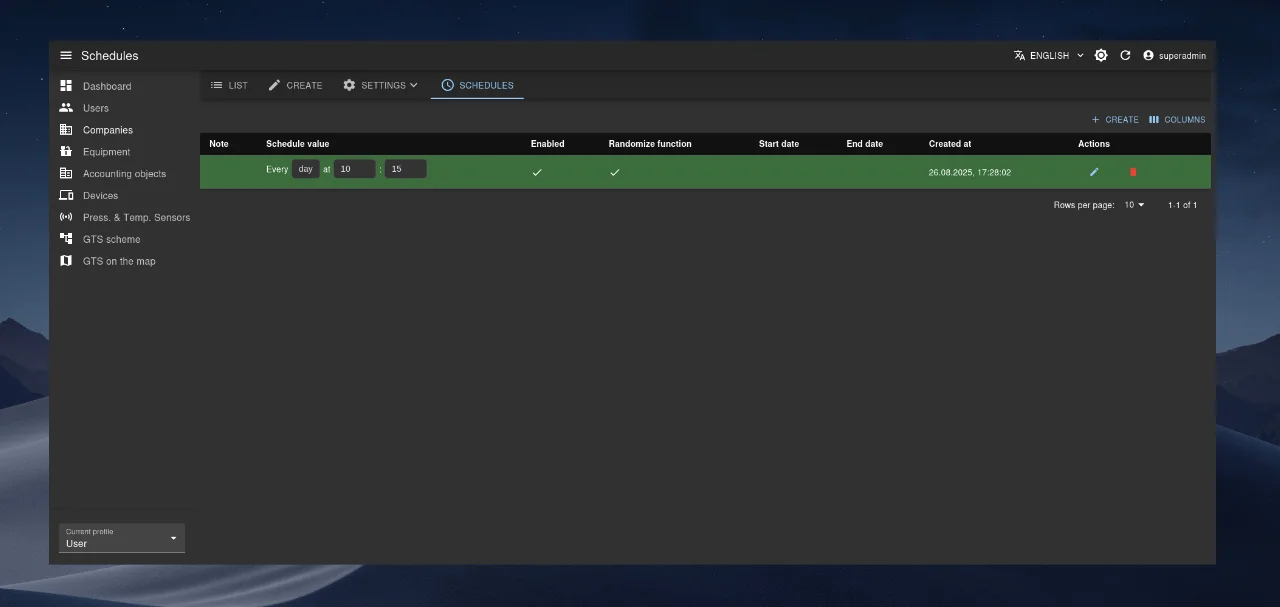
The schedule creation/editing form is straightforward and allows you to define:
- The schedule itself (e.g., every 15 minutes, once per hour, etc.),
- The validity period (date/time range during which the schedule is active),
- The Enabled/Disabled status (whether the schedule is currently applied),
- The Randomization option (whether to apply a small random time offset—within a few minutes—to distribute server load).
Data Monitoring Module
This module enables real-time monitoring of IoT device status and allows users to view actual parameter values.
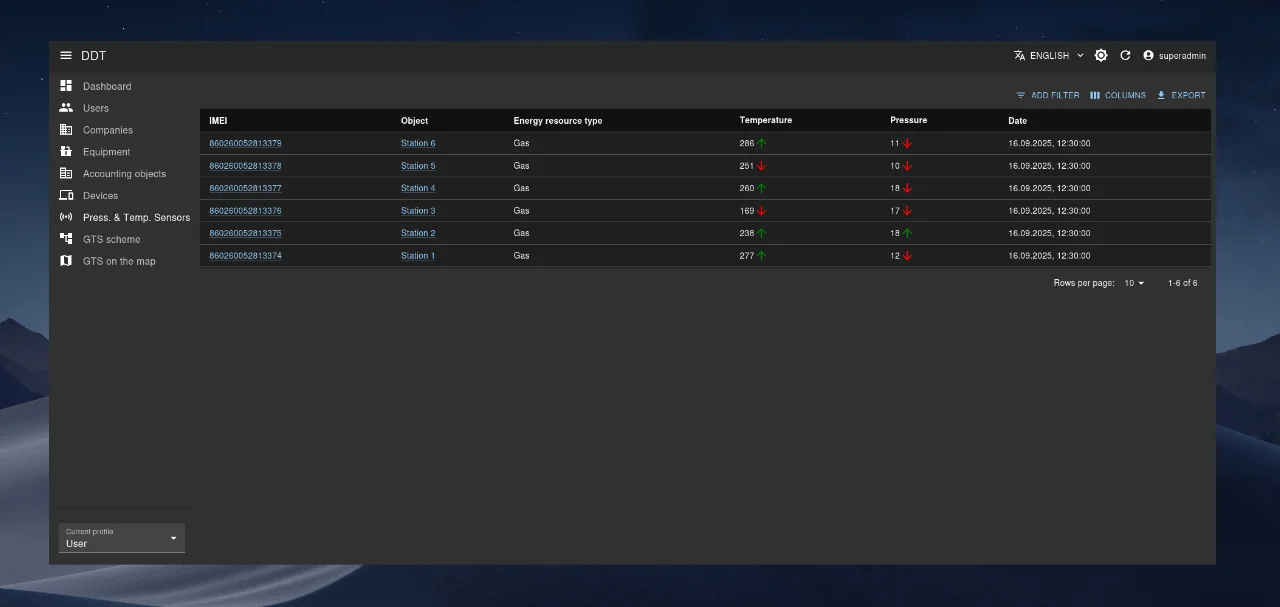
On the device detail page, two tabs are available: Data Log and Chart, providing different ways to access telemetry data.
Data Log Tab
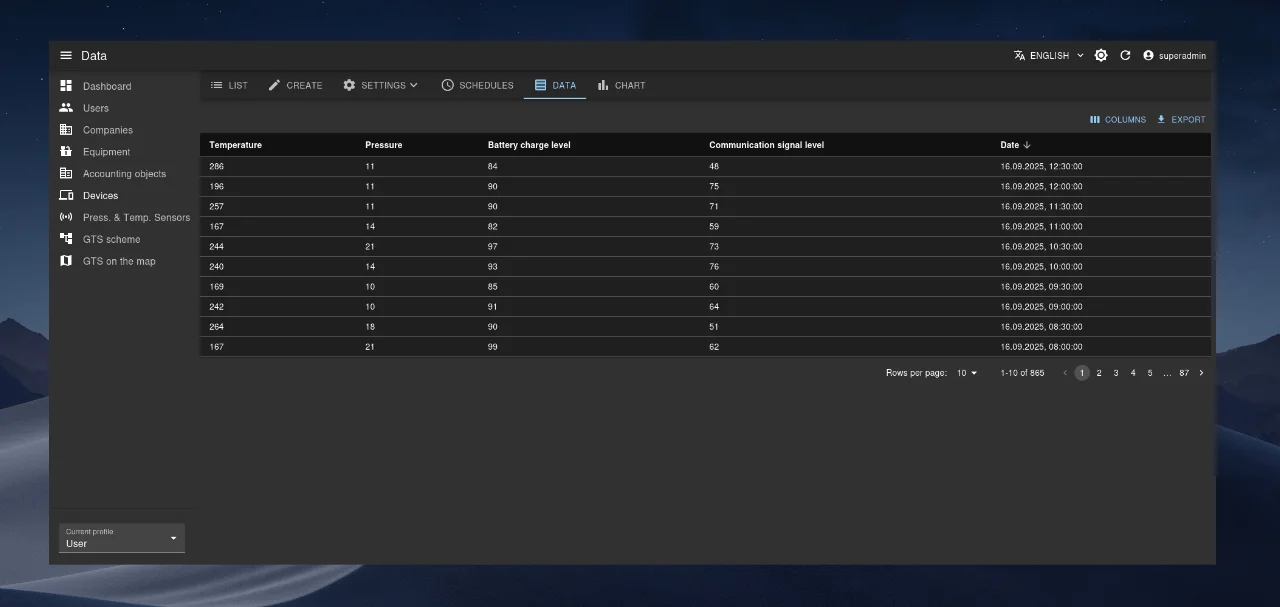
The Data Log tab displays a simple table of parameter values for a selected device on a specific date. Data appears in real time. Users can sort, filter, and export the data in various formats.
Chart Tab
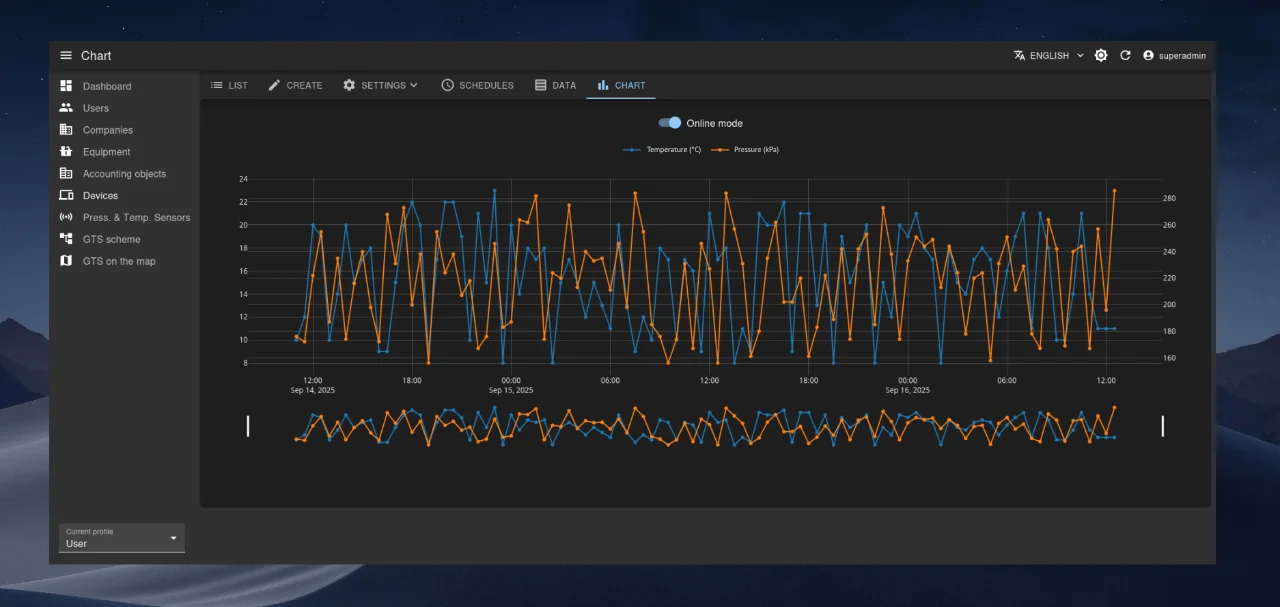
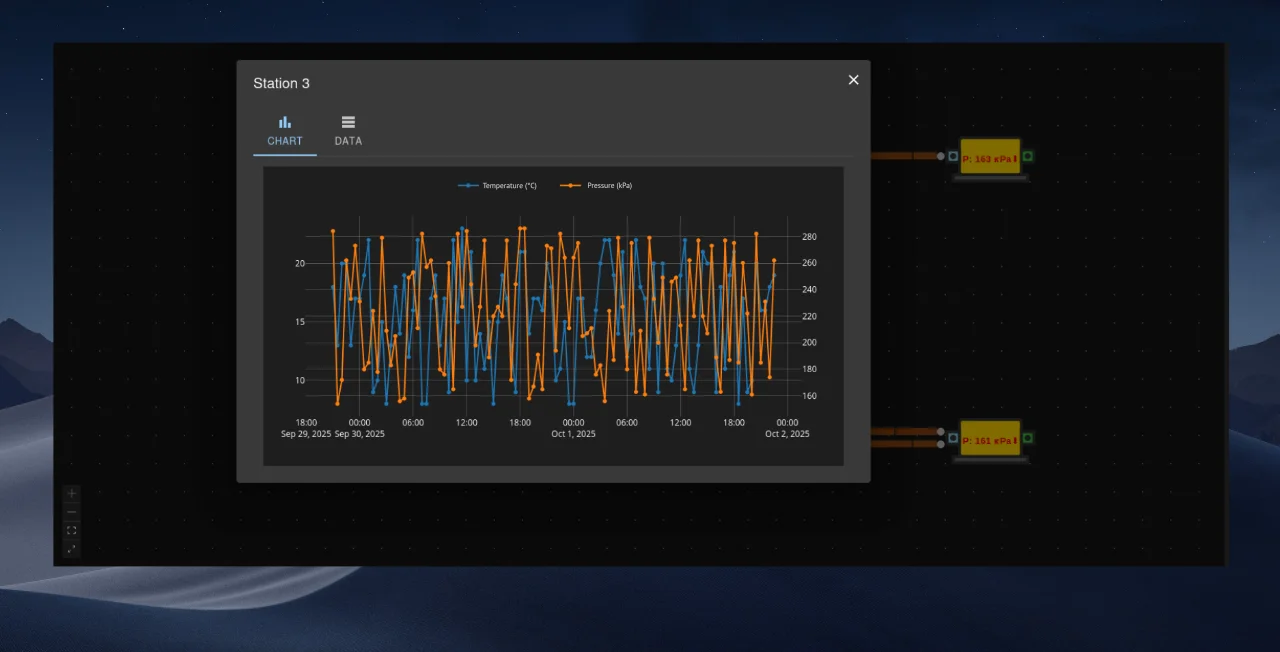
The Chart tab allows correlation analysis of multiple IoT device parameters over a selected time range.
By default, the chart operates in real-time mode, but users can switch to historical mode to analyze data for any custom date range.
The chart includes numerous interactive tools:
- Area selection
- Time navigation (panning)
- Zooming
- Fullscreen toggle
- Export as an image
Object Map Module
This module displays a geographic map with monitoring objects marked as location-based pins (each representing an object with installed IoT devices).
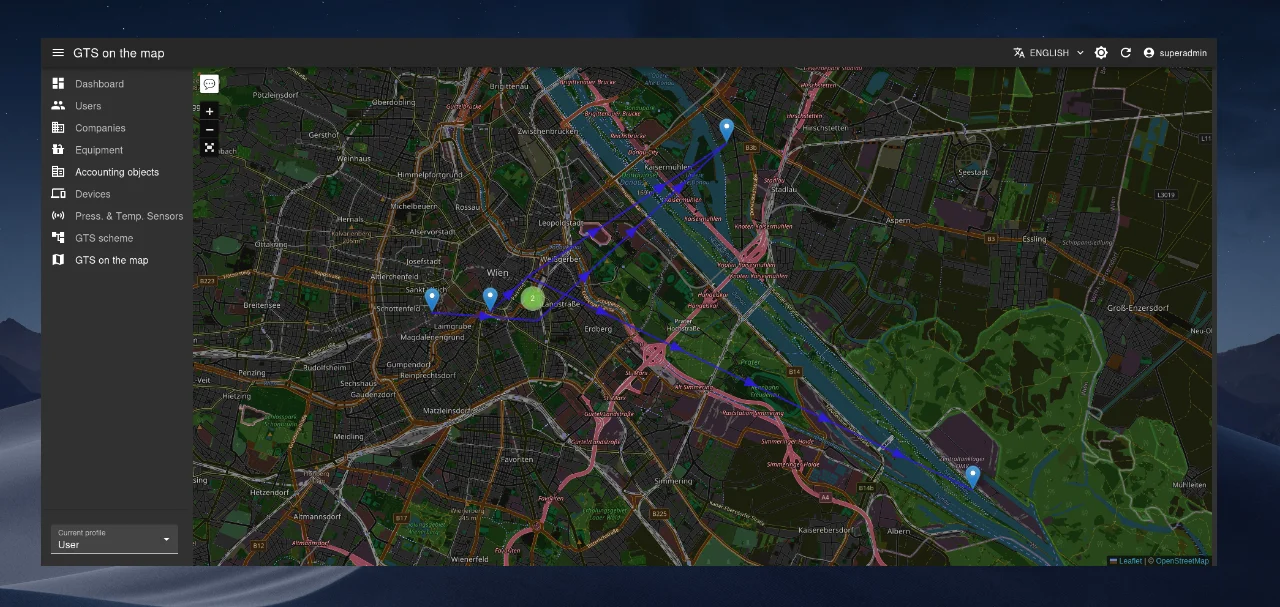
It provides a visual overview of object locations, their spatial relationships, and real-time status of installed IoT devices.
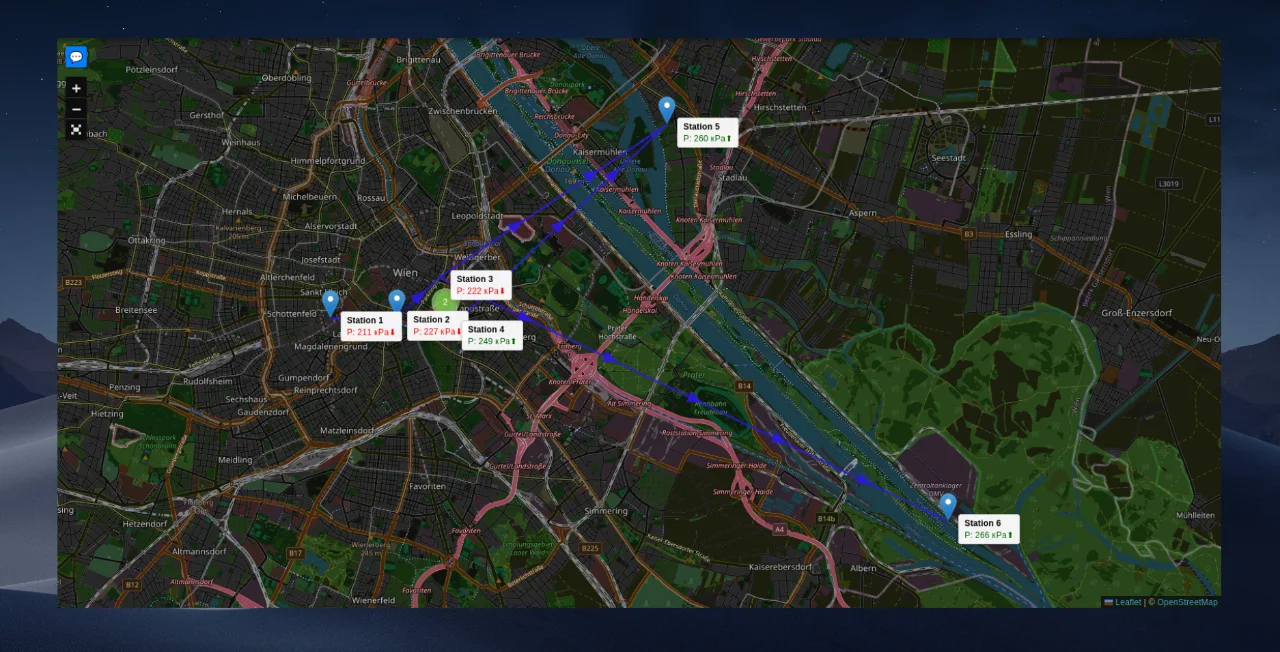
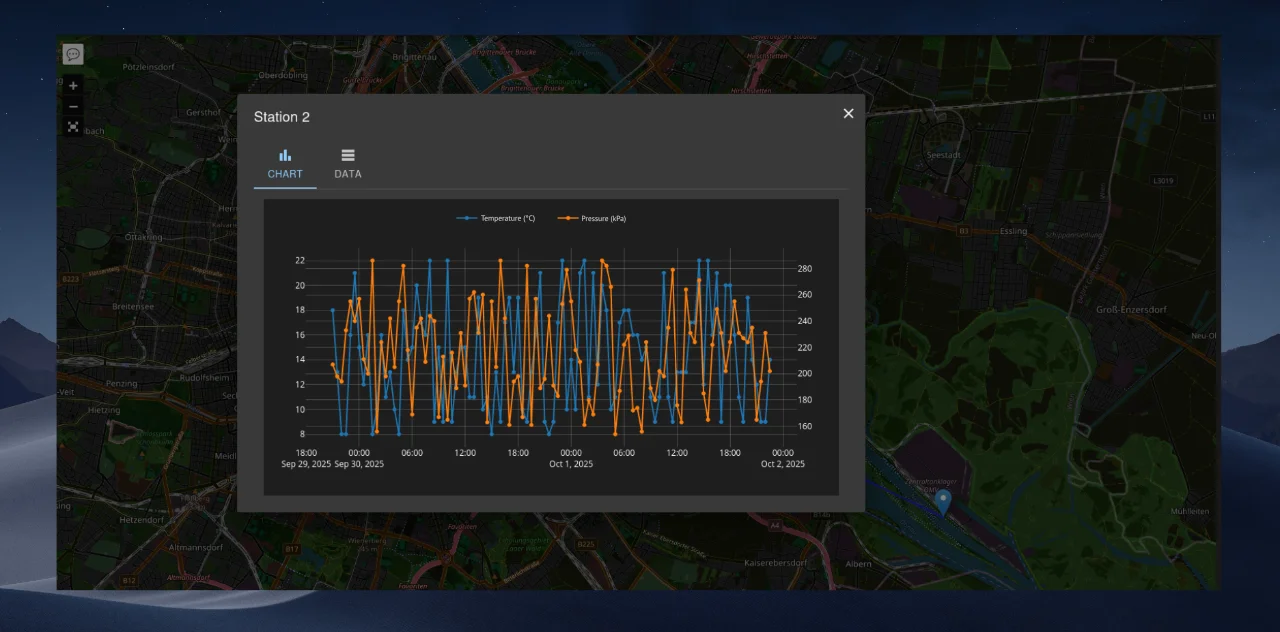
Clicking a marker opens a modal window showing all current parameter values for that object, presented either as a table or a chart.
The module also features a toolbar in the top-left corner of the map:
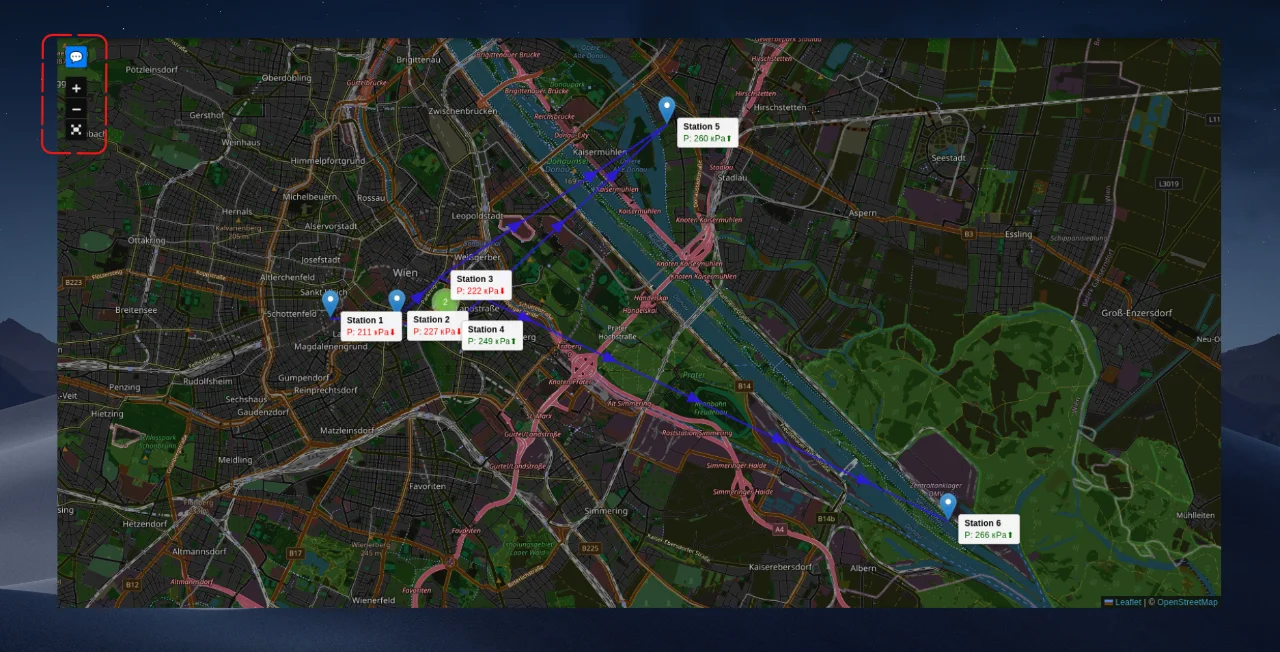
The toolbar includes:
- Zoom in/out buttons
- Fullscreen toggle
- Toggle for real-time parameter tooltips on markers
Object Diagram Module
This module visualizes object relationships as a mimic diagram (e.g., a gas distribution network for a district, city, region, or country).
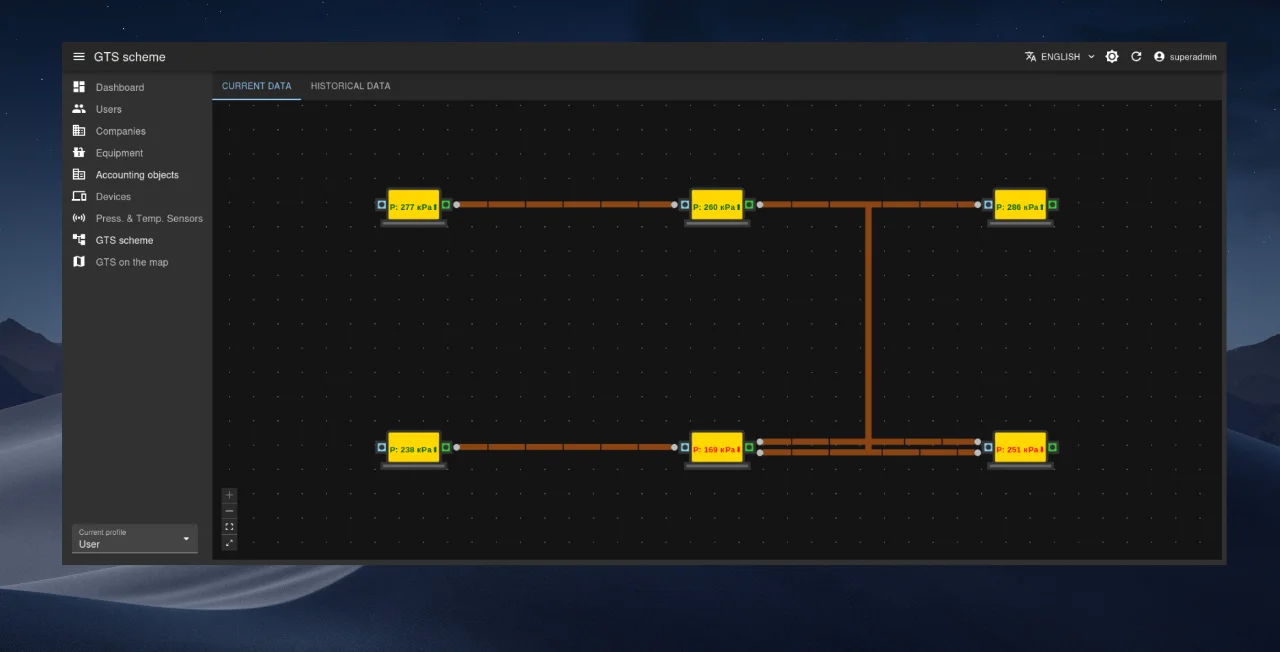
It clearly shows parent-child relationships, displays real-time values of key parameters from IoT devices, and provides detailed information when clicking on any object icon—similar to the marker click behavior in the Object Map module.
The mimic diagram is built automatically based on the Parent Object field specified when creating or editing a metering point.
The module offers two viewing modes via tabs:
- Current Data: Displays real-time object status.
- Historical Data: Shows the state of the diagram for a selected past date.
-
Applies only to devices that support this functionality. ↩︎